You've probably been in this position already. You approved budget for paid ads, SEO, content, email, or social media. You got reports back with traffic, clicks, impressions, and maybe a few conversion numbers, but you still couldn't answer the one question that matters most: is the marketing helping the business grow?
That gap is where a lot of small and mid-sized companies get stuck. The team is busy. Campaigns are live. Data exists. But the measurement system is weak, inconsistent, or disconnected from revenue. Marketing starts to feel like a cost center instead of a managed investment.
The fix isn't more dashboards. It's a clearer way to connect business goals, channel metrics, financial outcomes, and day-to-day decisions. If you want to understand how to measure marketing success, start by building a system that tells you what to track, why it matters, and what action to take next.
Table of Contents
- Moving Beyond the Marketing Black Box
- Aligning Marketing Goals with Business Objectives
- Selecting the Right KPIs for Each Funnel Stage
- Calculating ROI and Key Financial Metrics
- Building Your Marketing Dashboard and Reporting Cadence
- Using Measurement to Optimize and Grow
Moving Beyond the Marketing Black Box
When marketing feels opaque, businesses usually respond in one of two bad ways. They either keep spending and hope the activity turns into revenue, or they cut budget because they can't prove what's working. Neither approach is disciplined.
A better approach starts with visibility. You need a measurement system that connects spend, channel activity, lead quality, sales outcomes, and profitability. That sounds more complicated than it is. In practice, it means deciding what success looks like before the campaign launches, tagging your channels consistently, and reviewing performance in the same way every time.
For SMBs, this matters even more because resources are tighter. You don't have room for unclear attribution, duplicated reporting, or vanity metrics that look good in a slide deck and do nothing for the business.
Practical rule: If a metric can't influence a decision about budget, targeting, creative, offer, or channel mix, it probably doesn't belong on your core scorecard.
This is also where data quality becomes critical. If lead sources are mislabeled, conversions fire incorrectly, or CRM stages are inconsistent, your reports will mislead you. Teams working through reporting issues often benefit from tightening the inputs first.
Some businesses also make the reporting problem worse by forcing old funnel logic onto a buying journey that no longer fits. If your customers come back repeatedly through referrals, retention, and brand experience, it helps to think beyond a simple linear handoff. This perspective is explored well in from funnels to flywheels and rethinking growth through experience-driven models.
Start with the business outcome
Most reporting breaks because teams choose metrics first. That's backward. The right sequence is:
- Business objective
- Marketing objective
- KPI
- Channel metrics
- Action
If the business objective is profitability, the marketing objective might be generating qualified demand at an acceptable acquisition cost. The KPI might be CAC, CLV:CAC, ROI, or MER, depending on the channel mix and how mature the reporting is. The channel metrics below that might include landing page conversion rate, branded search growth, email response quality, or lead-to-opportunity rate.
Without that chain, reporting becomes decorative.
Aligning Marketing Goals with Business Objectives
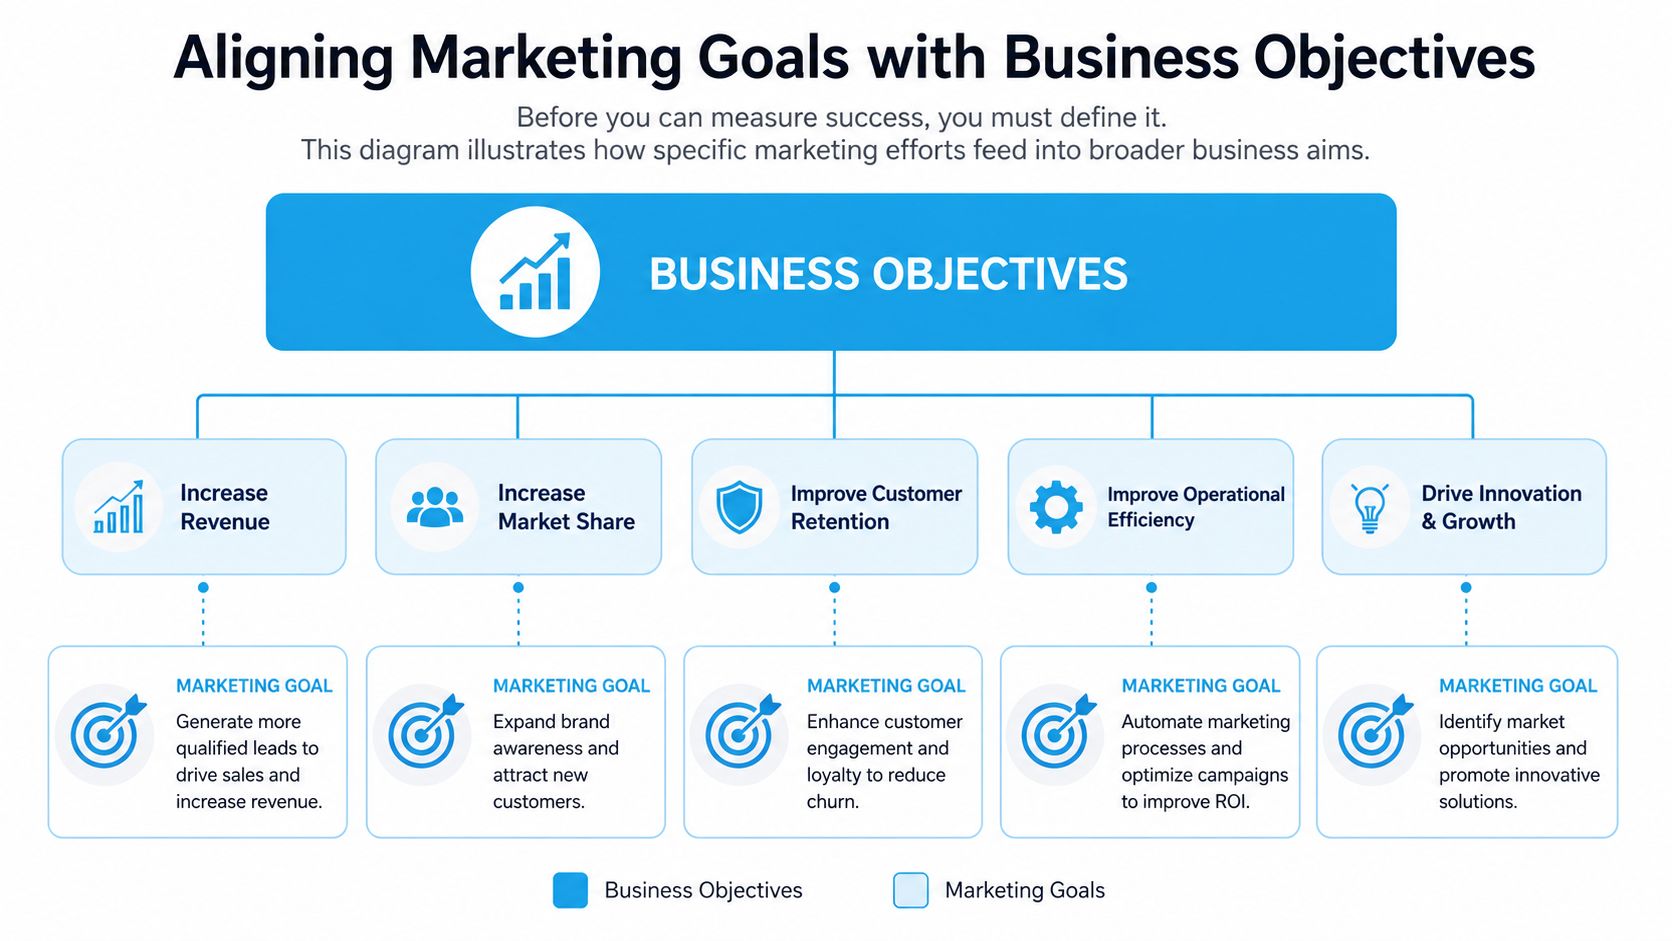
Before you can measure success, you need to define it in business terms. A campaign can hit its traffic target and still fail. An email sequence can produce engagement and still add nothing to pipeline. High activity is not the same as progress.
Start with the business outcome
Use a simple hierarchy:
| Level | What it answers | Example |
|---|---|---|
| Business objective | What must the company achieve? | Improve profitability |
| Marketing objective | What must marketing contribute? | Increase qualified leads from high-intent channels |
| KPI | How will you know it's working? | ROI, CAC, sales-qualified leads |
| Channel metric | What can the team optimize weekly? | Search conversion quality, landing page form completion, email response rate |
This approach forces discipline. If a metric doesn't clearly support a business objective, it's not a KPI. It may still be useful operationally, but it shouldn't lead the conversation.
For SMBs, I recommend choosing one primary business objective for each planning cycle. That could be improving margin, entering a new market, increasing recurring revenue, or reducing dependence on one acquisition channel. Then assign marketing work to support that priority directly.
Build a goal hierarchy that people can use
A practical hierarchy should fit on one page. If it needs a workshop to interpret, it won't survive first contact with a busy leadership team.
Here's a common example for a service business:
- Business objective: Improve profitability
- Marketing objective: Generate more sales opportunities from channels with stronger buying intent
- Primary KPIs: campaign ROI, CAC, close rate by source
- Secondary metrics: landing page conversion quality, organic lead volume, booked consultation rate
And here's a different example for a company expanding into a new region:
- Business objective: Establish traction in a new market
- Marketing objective: Build awareness and generate early-stage demand in the target geography
- Primary KPIs: qualified inquiries from the region, sales pipeline sourced from the region
- Secondary metrics: branded search activity, regional website engagement, local landing page conversion
A balanced framework also needs both short-term and long-term measures. The Product Marketing Alliance recommends a 60/40 split between leading indicators and lagging indicators so teams stay proactive while still being accountable for final outcomes, as outlined in its guide to measuring product marketing success.
Don't let lagging metrics dominate the entire system. Revenue tells you what happened. Leading indicators help you change what happens next.
That balance is what keeps measurement useful. If you only watch revenue, you react too late. If you only watch engagement, you can fool yourself for months.
Selecting the Right KPIs for Each Funnel Stage
Not all metrics deserve executive attention. Some are diagnostic. Some are directional. A much smaller set should function as true KPIs.
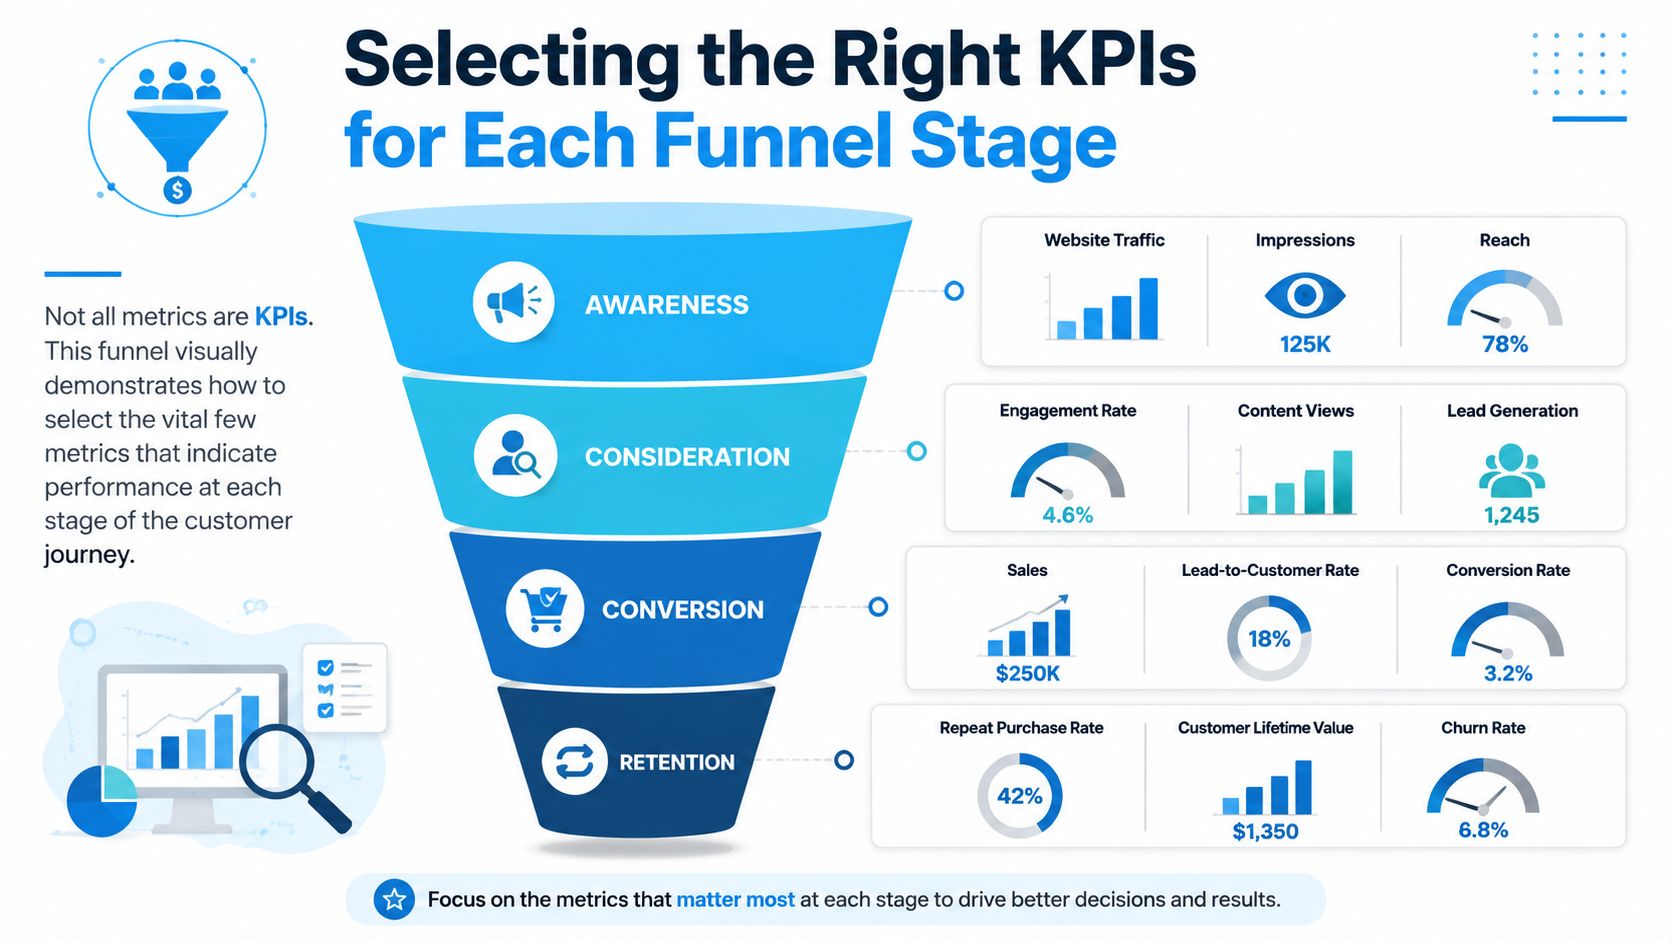
The easiest way to choose them is to map metrics to the buyer journey. That keeps you from judging awareness campaigns by immediate sales, or retention programs by first-touch lead volume.
Measure the funnel, not just the finish line
If you only track bottom-line revenue, you won't know where performance is breaking. If you only track top-of-funnel activity, you won't know whether the activity is commercially useful. Good measurement covers both.
A practical scorecard usually includes:
- Leading indicators: metrics you can influence now, such as qualified traffic, demo requests, content engagement, or sales call bookings
- Lagging indicators: metrics that confirm business impact, such as revenue, CAC efficiency, retention quality, or campaign ROI
That's where the funnel helps. It gives each metric a job.
A click is not proof of progress. It's only evidence that someone noticed you.
For teams trying to move beyond surface engagement metrics, this article on attention metrics and what to measure beyond CTR is a useful complement, especially for content-heavy and social-led programs.
A practical KPI map by stage
Awareness
At the awareness stage, the job is reach and discovery among the right audience, not immediate revenue attribution from every impression.
Useful metrics include:
- Qualified website traffic: Not just visits, but visits from relevant audiences and channels
- Search visibility signals: Organic presence for topics that match buyer intent
- Content engagement quality: Time on key pages, onward navigation, repeat visits
- Paid reach quality: Impressions and clicks paired with audience relevance, not reported in isolation
Weak measurement at this stage usually sounds like this: “Traffic is up.” Better measurement sounds like this: “Traffic from high-intent content is increasing and those visitors are moving into consideration actions.”
Consideration
At this stage, prospects begin comparing options. The best KPIs here show movement toward buying behavior.
Examples:
- Lead magnet completions
- Demo or consultation requests
- Email engagement tied to nurture sequences
- Returning visitors to product or service pages
- Funnel progression by source
For SEO, PPC, and content campaigns, this stage often reveals channel quality differences. One source may generate more leads. Another may generate fewer but much stronger leads. That distinction matters.
Conversion
This is the stage most businesses jump to first. It matters, but it's not the whole system.
Track metrics such as:
- Sales-qualified leads
- Lead-to-customer rate
- Opportunity creation
- Revenue by source or campaign
- Campaign-level ROI or ROAS where applicable
If you're running paid search or paid social, the conversion stage is also where channel-level economics become much clearer.
Loyalty and retention
A lot of SMB reporting ignores post-sale performance, which is a mistake. A campaign that brings in customers who don't stay, don't buy again, or require too much support can look efficient upfront and still hurt the business later.
Retention metrics may include:
- Repeat purchase behavior
- Customer expansion signals
- Referral activity
- Engagement with customer email or account content
- CLV trends by acquisition source
This stage is where marketing measurement starts to connect with customer success, sales, and operations. That's a good thing. The business experiences one customer journey even if internal teams report on it separately.
Calculating ROI and Key Financial Metrics
A common SMB reporting problem looks like this. Leads are up, traffic is up, the agency says performance is strong, and the owner still cannot answer a basic question. Did marketing create profitable growth, or did it just create activity?
Financial metrics close that gap. For a resource-constrained team, the goal is not to track every number available. The goal is to build a small financial model you can trust, then use it every month to decide where to keep spending, where to cut, and where to be patient.
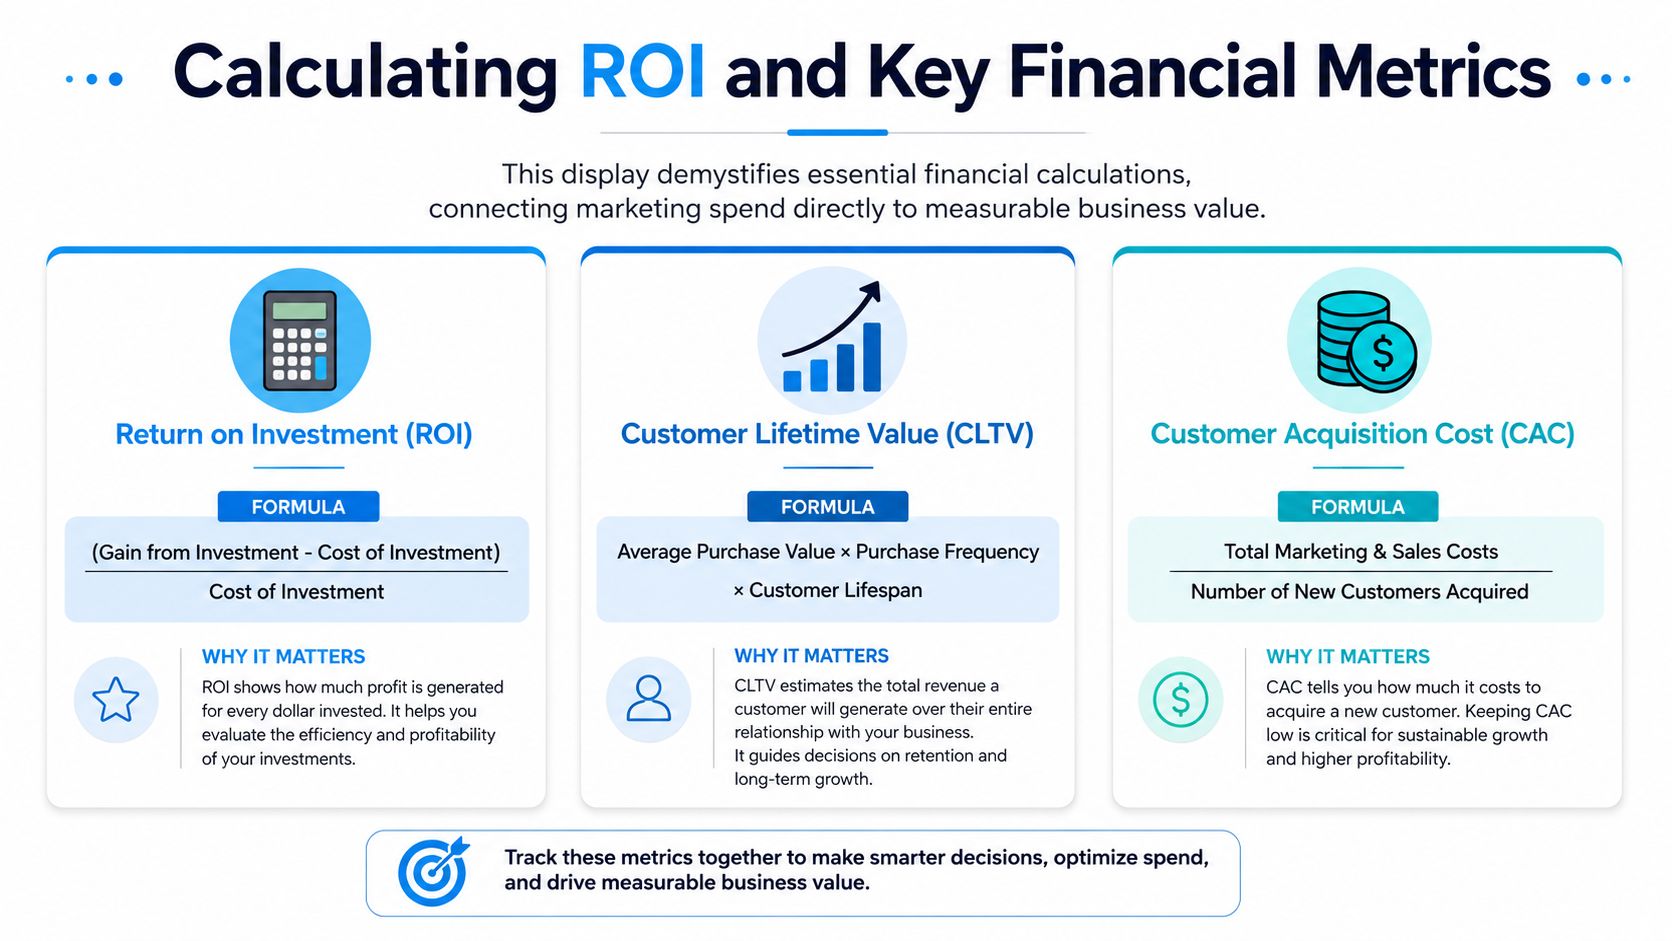
For most SMBs, that model starts with four numbers: ROI, ROAS, CAC, and CLV.
Use ROI to judge actual return
Siteimprove explains the standard marketing ROI formula in its article on marketing metrics that matter: (Revenue from campaign – Campaign cost) / Campaign cost × 100.
Use it with full costs, not partial ones. That means media spend, creative, landing page work, agency fees, software, discounts tied to the offer, and internal labor if the team spent meaningful time supporting the campaign. SMBs often overstate ROI because they count revenue precisely and costs loosely.
A simple example:
- Campaign revenue: $8,000
- Campaign cost: $2,000
Using the formula:
- ROI = ($8,000 – $2,000) / $2,000 × 100
- ROI = 300
That campaign produced a 300% ROI.
The practical trade-off is timing. ROI is easy to calculate for short sales cycles and direct-response offers. It gets less clean in long B2B cycles, SEO programs, and campaigns that influence multiple touches before conversion. In those cases, use a consistent attribution rule and document it. Imperfect but consistent beats precise-looking numbers that change every quarter.
A short walkthrough can help if your team needs to explain ROI clearly in meetings:
Use ROAS to manage paid channel efficiency
ROAS focuses on advertising revenue relative to ad spend. It is narrower than ROI, which makes it useful for weekly paid media decisions.
The formula is simple:
- ROAS = Revenue from ads / Ad spend
Example:
- Ad spend: $1,000
- Revenue from that ad spend: $4,000
- ROAS: 4.0
That means the campaign generated $4 in revenue for every $1 spent on ads.
ROAS helps compare channels, campaigns, audiences, and creative quickly. It is one of the best operating metrics for paid search, paid social, display, and marketplace ads. It is also easy to misuse. A campaign can post a strong ROAS and still hurt the business if margins are thin, close rates are weak after the lead comes in, or those customers churn quickly.
BCG makes that broader measurement point in its article on more effective marketing measurement. The firm argues for a tighter set of core metrics, warns against vanity-heavy reporting, and points to MER, or Marketing Efficiency Ratio, as a useful top-line check. MER is calculated as total revenue divided by total ad spend.
I use the distinction this way. ROAS answers, "Is this paid campaign efficient?" MER and ROI answer, "Is the overall marketing program paying off?"
If your team is trying to improve paid media decisions with better forecasting and analysis, this guide on using AI analytics to maximize ad ROI adds practical context.
Use CAC and CLV to test whether growth is sustainable
Customer acquisition cost shows what you spend to win a customer. Customer lifetime value shows what that customer is worth after the sale. SMBs need both, especially when budgets are tight and one weak channel can absorb too much spend before anyone notices.
Qlik explains in its overview of marketing KPIs that CLV is calculated as Average purchase value × Purchase frequency × Customer lifespan. Qlik also notes in the same guide that the CLV:CAC ratio is a key health check, and that many businesses use 3:1 as a benchmark for a sustainable model.
Here is the working model:
| Metric | Formula | What it tells you |
|---|---|---|
| CAC | Total acquisition spend / number of new customers | What it costs to acquire a customer |
| CLV | Average purchase value × purchase frequency × customer lifespan | Revenue value of a customer over time |
| CLV:CAC | CLV / CAC | Whether customer economics support growth |
Measurement becomes useful to an owner, not just a marketing manager. One source may bring in low-cost leads that close poorly or buy once and disappear. Another may look expensive on the front end but produce customers who stay longer, buy again, and refer others.
That difference changes budget decisions. It also changes how patient you should be with channels like SEO, content, email nurture, and partner marketing, where the first conversion rarely captures the full value created.
Building Your Marketing Dashboard and Reporting Cadence
A dashboard should help people make decisions quickly. Most don't. They become crowded with every available metric, updated constantly, and used rarely.
The better model is a metric pyramid. Put high-level business measures at the top, channel and campaign measures in the middle, and tactical diagnostics at the bottom. Different people need different levels of detail.
Structure the dashboard as a metric pyramid
At the top, leadership should see only the few numbers tied directly to business performance. That might include ROI, MER, CAC trend, pipeline contribution, or retention quality. These are summary measures, not troubleshooting tools.
In the middle, marketing managers need channel-level visibility:
- Paid media performance
- Organic search contribution
- Email and nurture progression
- Landing page conversion
- Lead quality by source
At the bottom, specialists need the detailed metrics that explain movement:
- Search query patterns
- Ad creative performance
- Audience segment response
- Form drop-off behavior
- Page-level engagement
- CRM stage progression
A clean dashboard usually answers three questions in one view:
- Are we on track against business goals?
- Which channels are helping or hurting?
- What should the team change this week?
If your reporting can't answer all three, it's incomplete.
Set a reporting rhythm people will actually follow
Cadence matters as much as content. Too frequent, and the team chases noise. Too infrequent, and problems linger.
A workable rhythm for most SMBs looks like this:
Weekly review
Use this for tactical decisions. Check campaign pacing, landing page issues, sales handoff friction, and major shifts in channel behavior. This meeting should be short and action-oriented.
Monthly review
Use this for channel evaluation. Compare paid, organic, email, content, referral, and direct contribution. Look for source quality, not just volume. Review CAC direction and any developing pipeline patterns.
Quarterly review
Use this for strategy. Revisit the business objective, the KPI hierarchy, and whether your current mix still makes sense. This is also the right time to assess whether your acquisition model is sustainable over time.
Teams rarely fail because they lack data. They fail because nobody agreed on which numbers matter, who owns them, or when decisions get made.
Keep the dashboard simple enough to maintain in a spreadsheet if necessary, or use tools like Looker Studio, HubSpot, or a BI platform if your stack supports it. The tool matters less than the consistency.
Using Measurement to Optimize and Grow
A business owner reviews the dashboard on Monday, sees leads up 30 percent, and assumes the month is on track. By Friday, sales is complaining that the pipeline is full of poor-fit prospects, paid spend is running hot, and close rates are slipping. That is the gap between reporting activity and managing performance.
Measurement should help an SMB make better trade-offs with limited time, budget, and team capacity. The job is not to collect more numbers. The job is to identify the next change most likely to improve revenue, margin, or retention.
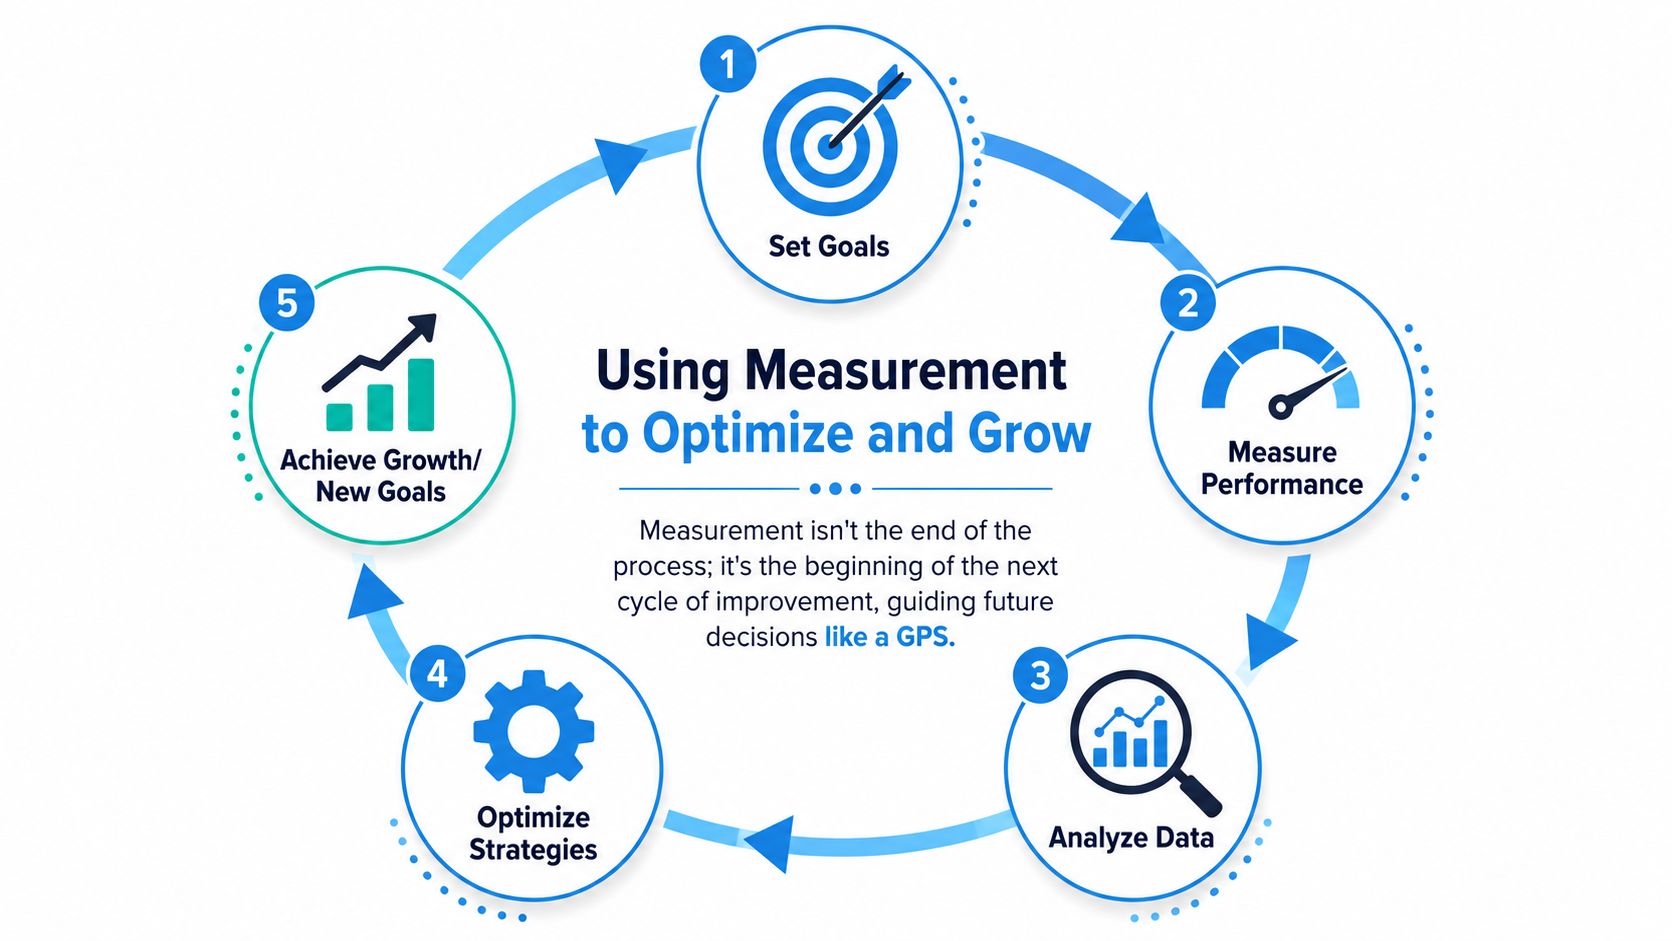
Run measurement as an operating loop
The simplest version works well for small and midsize teams:
- Measure
- Diagnose
- Test
- Scale or stop
Each step needs a clear owner. Someone checks the numbers. Someone decides what probably caused the change. Someone runs the test. Someone confirms whether the result justifies more budget, more time, or a full rollback.
That discipline prevents a common SMB mistake. Teams spot one weak metric and start changing ads, landing pages, offers, and follow-up at the same time. Then results move, but nobody knows why.
Use the numbers to isolate the constraint first. If traffic is rising but qualified leads are flat, the problem usually sits in targeting, offer fit, or page-message alignment. If lead volume looks healthy but opportunities are weak, the issue often sits later in the chain, poor lead qualification, slow sales follow-up, or a mismatch between campaign promise and actual buyer intent. If customer acquisition cost is acceptable but payback is too slow, retention and expansion may deserve more attention than top-of-funnel volume.
Match the response to the point of failure
Different performance problems call for different fixes.
- Awareness is weak: improve distribution, channel selection, search visibility, or audience targeting
- Engagement is weak: tighten messaging, strengthen the offer, and make the next step clearer
- Conversion is weak: reduce form friction, improve page relevance, and review sales response time
- Retention is weak: examine onboarding, customer fit, pricing expectations, and source quality
The goal is not to make every metric go up at once. The goal is to improve the metric that has the strongest connection to profit.
For example, an SMB might find that paid search produces fewer leads than paid social but closes at a much higher rate. In that case, the right move may be to cut social spend, accept lower lead volume, and put more budget into the channel that produces better customers. That decision can look uncomfortable in a dashboard built around lead totals. It looks obvious in a system tied to revenue and payback.
Use tests that fit your resources
Resource-constrained teams do not need a complicated experimentation program. They need a short queue of practical tests tied to known bottlenecks.
A useful test backlog might include:
- changing one headline and offer on a high-traffic landing page
- shortening a form for bottom-of-funnel campaigns
- shifting budget from a high-CAC channel to one with better sales acceptance
- tightening lead scoring criteria before handoff to sales
- rewriting an email sequence by buyer stage instead of engagement rate
Keep the test small enough to measure, but important enough to matter. If a result will not affect budget, process, or prioritization, it is probably not worth running.
Strong teams use measurement to decide what to fix, what to fund, and what to cut.
Growth comes from repeated reallocation. More budget goes to channels that produce profitable customers. More effort goes to messages that improve conversion quality, not just click volume. Weak tactics get removed before they drain another quarter of time and spend.
If your current setup cannot support those decisions, start with a focused audit. Clean up tracking, reduce the KPI list, confirm stage definitions with sales, and make sure every major metric connects back to a business outcome. That is how measurement becomes a working system instead of a monthly report.
If you want help building that kind of measurement system, SharedTEAMS offers a practical next step. Their managed marketing team, led by an accountable Marketing Director, can help established small businesses audit tracking, clarify KPIs, improve reporting, and turn strategy into consistent execution without building a full in-house department.